
DWS Microrheology of Aqueous Polymer Solutions
Related Product
DWS RheoLab™
The DWS RheoLab™ is a contact-free rheometer. It provides access to the sample's viscoelastic properties over an unmatched frequency range and enables the study of textures and microstructures while requiring only small sample volumes.
Summary
In this application note, we show how to use the DWS RheoLab from LS Instruments to characterize the linear viscoelastic properties of aqueous polymer solutions. Moreover, employing the Cox-Merz relationship, we obtain flow-curve data that typically requires non-linear steady shear rheology.
We apply DWS microrheology to an aqueous solution of a commercial linear copolymer (acrylamide/acrylate) utilized for enhanced oil recovery. However, this contact-free technology allows also the characterization of more complex polymer solutions, e.g. with very volatile solvents due to the possibility to seal the sample cuvettes.
Introduction
Diffusing Wave Spectroscopy (DWS) is a powerful optical characterization method, especially well-suited to study the rheological properties of complex fluids [1-4]. The method is based on the analysis of the fluctuations of coherent laser light scattered multiple times from tracer beads embedded in a sample [1]. The DWS RheoLab from LS Instruments is the first laboratory instrument to conduct such measurements accurately and conveniently.
The purpose of this application note is to demonstrate that DWS can be used to assess rapidly the rheological properties of polymer and biopolymer solutions [3,4] requiring only small sample volumes of the order of 0.2-0.3 mL.
Sample Preparation and Measurement
The polymer powder (Flopaam 3230S, SNF France) was added to distilled water and stirred at a concentration of 1.31 wt% (percentage by weight) and left overnight in order to dissolve completely. The samples (0.1 wt% and 1.0 wt%) were prepared from the stock solution with the predissolved polymer, distilled water, and the tracer particle dispersion (5.0 wt% polystyrene particles with diameter of 1.0 µm in water). Note that the final polymer concentration refers to the polymer concentration in the solvent, i.e. excluding the contribution of the tracer particles.
For the DWS measurements, the tracer particle concentration of 1.2 wt% ensures that for the chosen cuvette thickness of L=2 mm (see Figure 1) the light propagation is diffusive. This requires that L/l*>6, where l* is the measured light scattering transport mean free path that is automatically determined by the DWS RheoLab during the measurement. All DWS measurements were carried out in transmission mode with a total measurement time of 360 s per sample. For efficient measurements of correlation times >0.2 s, the DWS RheoLab employs the patented echo technique, which allows the accurate measurement of lag times in the range 0.2 to 12 s in only 30-60 s measurement time. This, in turn, provides accurate rheological data for viscoelastic liquids and solids over a frequency range 0.1<ω<106 [rad/s]. All data treatment is automatically conducted by the software of the DWS RheoLab.
For comparison, we performed bulk rheology with an Anton Paar Rheometer MCR300 using a cone plate geometry (CP50-1) with 1° angle. The oscillatory amplitude chosen was 1%, which was found to be in the linear viscoelastic range.
For the bulk rheology measurements, samples without tracer particles were prepared. All measurements were done at a temperature of 20°C.
Note that the overall measurement time for DWS microrheology is short compared to oscillatory shear experiments which take about 20-30 minutes to cover a range of 0.1-100 rad/s. Moreover, in mechanical rheometry significantly longer times are needed for loading and possibly sealing the sample as well as to make sure that the measurements are carried out in the linear viscoelastic regime via a strain sweep measurement.
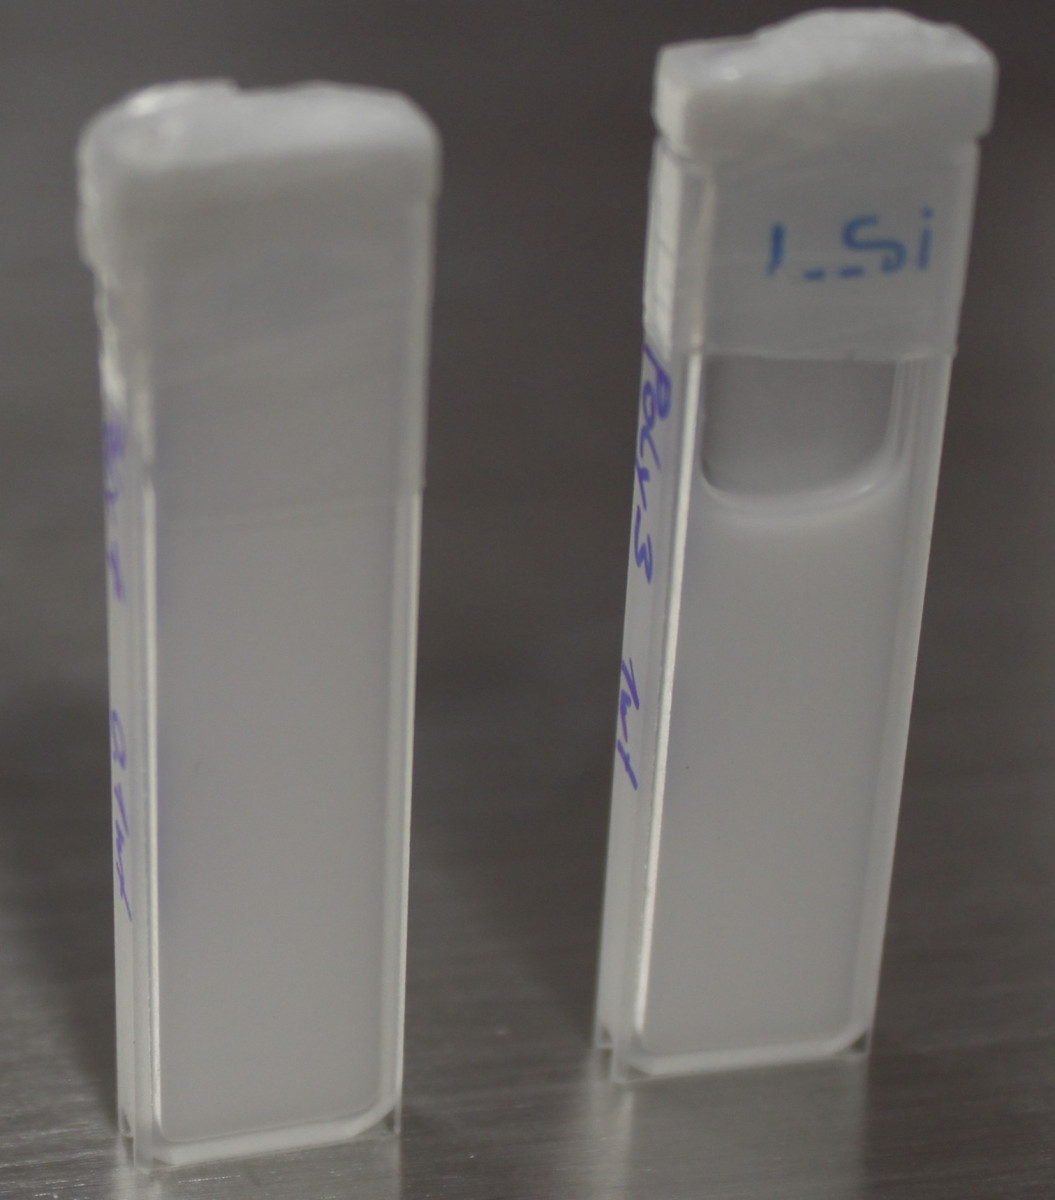
Figure 1. Samples prepared for DWS microrheology on polymer solutions:
Dilute polymer solution 0.1 wt% (left), and concentrated polymer solution 1.0 wt% (right). We use cuvettes with an optical path of 2 mm for all samples. The required sample volume was about 0.3 mL
Results and Discussion
The two different polymer concentrations 1 wt% and 0.1 wt% are above and below the overlap concentration c*. Figure 2 shows the storage modulus G' and loss modulus G'' obtained from DWS-microrheology and the data obtained from bulk rheology. The data from bulk rheology is rescaled by a factor (0.45 for 1.0 wt% polymer, and 1.1 for 0.1 wt% polymer) to superimpose it to the DWS data. Such scaling factors are commonly observed and reflect the imperfect coupling of the tracer particles to the viscoelastic matrix [3].
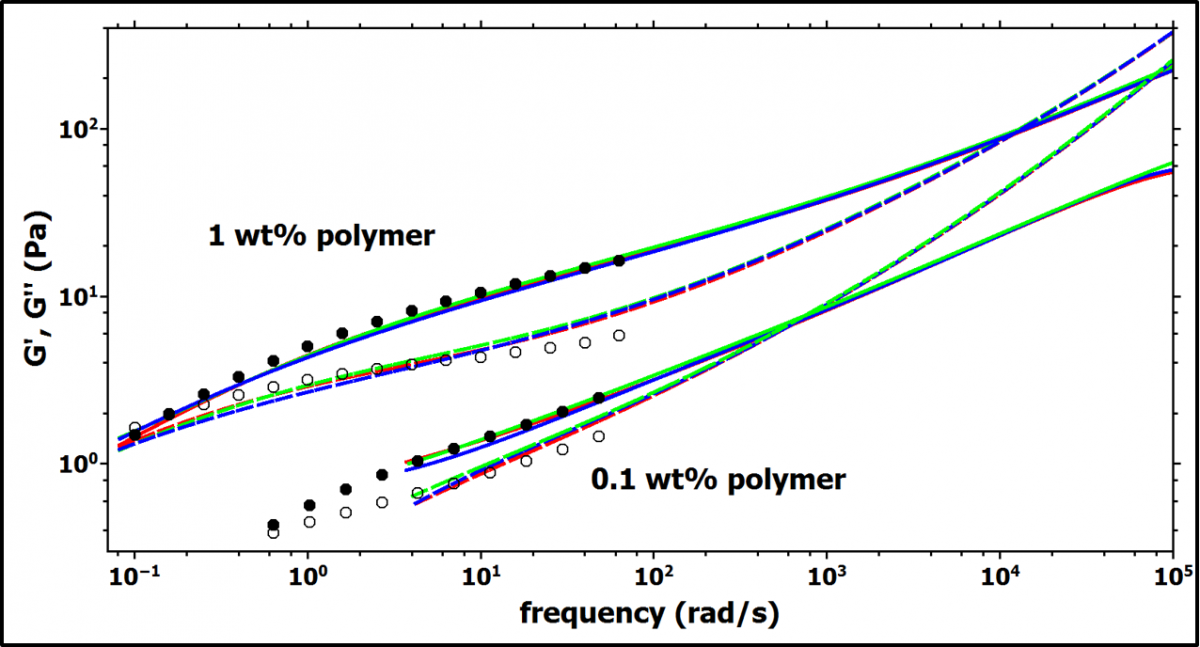
Figure 2. The storage (G', solid lines and full symbols) and loss (G'', dashed lines and open symbols) moduli obtained from DWS microrheology (lines) are shown as well as the results from bulk rheology (symbols). The DWS data shows 3 independent measurements (lines with different colors) to demonstrate the reproducibility. The data from bulk rheology is rescaled by a factor 0.45 for 1.0 wt% polymer and 1.1 for 0.1 wt% polymer, respectively.
Rheological data from polymeric solutions typically follow the Cox-Merz relationship that links the linear regime as measured by passive microrheology to the non-linear rheology accessed during a flow-curve experiment [5].
The Cox-Merz relationship states that the absolute value of the complex viscosity is equal to the shear viscosity and has been found to hold for almost all polymer melts, and concentrated and semi-dilute solutions [6]. Figure 3 compares the absolute values of the complex viscosity as obtained from DWS microrheology with the shear viscosity measured using
the mechanical rheometer. The flow curve data from bulk rheology was rescaled with the same scaling factors as discussed above. The two data sets show good agreement in the overlapping frequency (shear rate) range.
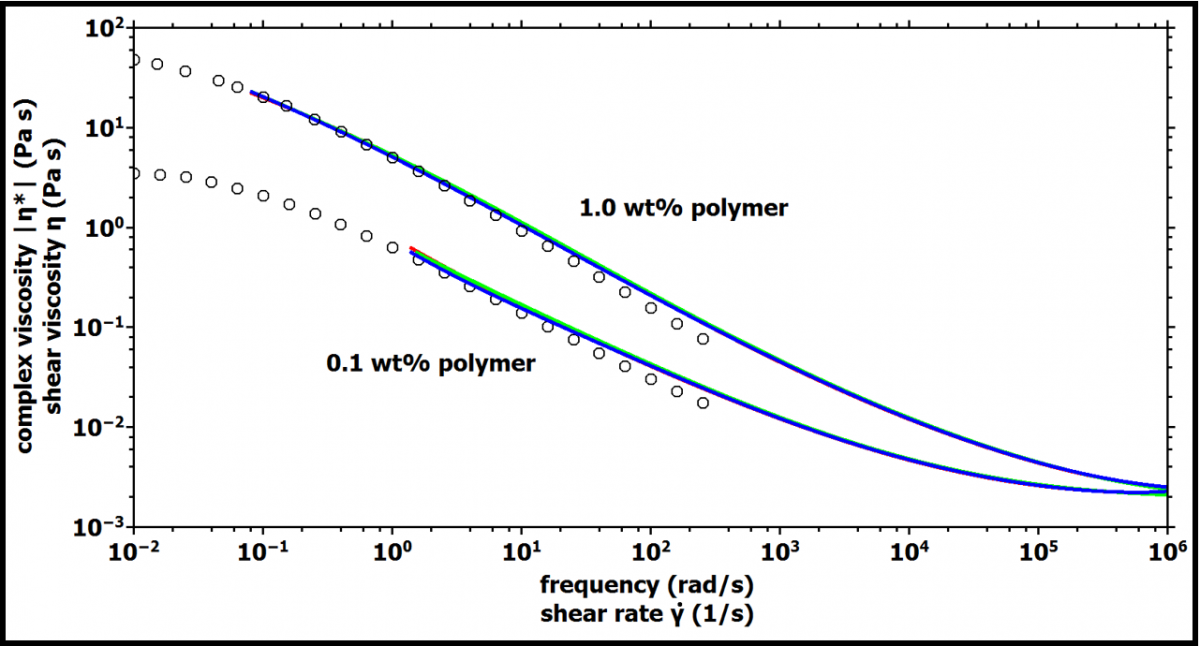
Figure 3. Application of the Cox-Merz rule: Complex viscosity versus frequency as obtained by DWS (lines) and shear viscosity versus shear rate (circles) obtained by bulk rheology. The data from bulk rheology is rescaled by a factor 0.45 for 1.0 wt% polymer and 1.1 for 0.1 wt% polymer, respectively.
It is important to note that for the higher polymer concentration the solution is highly viscoelastic and thus can only be characterized using DWS microrheology. DLS microrheology (available with the NanoLab 3D) requires samples with lower viscosity and the absence of low-frequency elastic moduli. This is due to the limited sensitivity to small particle displacements and the lacking possibility of performing ensemble averages in all common DLS instrument configurations. DWS with Echo technology (LS Instruments patented) however can easily access samples such as the 1.0 wt% polymer solution studied here. Even the 0.1 wt% sample would only barely be suitable for DLS microrheology and would require measurement times of hours to obtain accurate data in the low-frequency regime.
Conclusion
We applied DWS microrheology to two different polymer solutions with concentrations 0.1 and 1.0 wt% adding about 1% in volume of polystyrene tracer beads. Measurements were carried out using sealed glass cuvettes for a duration of 6 minutes per sample.
The agreement with mechanical rheometry is found to be good to excellent over the range of frequencies accessible to both methods. The validity of the Cox-Merz rule for polymer solutions has been successfully established for both samples. The DWS data extends the frequency range accessible to the MHz range and requires only small sample values 0.2-0.3 mL.
References
[1] D.A. Weitz, and D.J. Pine, Diffusing-Wave Spectroscopy. In Dynamic Light Scattering; Brown, W., Ed.; Oxford University Press: New York, 652-720 (1993).
[2] T. G. Mason and D. A. Weitz, Optical Measurements of Frequency-Dependent Linear Viscoelastic Moduli of Complex Fluids, Phys. Rev. Lett. 74, 1250 (1995).
[3] Oelschlaeger C. et al., Chain Flexibility and Dynamics of Polysaccharide Hyaluronan in Entangled Solutions: A High Frequency Rheology and Diffusing Wave Spectroscopy Study, Bio-Macromolecules, 14, 3689-3696, (2013).
[4] N. Willenbacher, C. Oelschlaeger, M. Schöpferer, P. Fischer, F. Cardinaux and F. Scheffold, Broad Bandwidth Optical and Mechanical Rheometry of Wormlike Micelle Solutions, Physical Review Letters 99, 68302 (2007).
[5] W.P. Cox and E.H. Merz, Correlation of dynamic and steady flow viscosities, Colloid and Polymer 28, 619 (1958).
[6] T.S.R. Al-Hadithi, H.A. Barnes, K. Walters, The relationship between the linear (oscillatory) and nonlinear (steady-state) flow properties of a series of polymer and colloidal systems, Colloid & Polymer Science 270, 40-46 (1992).