
Characterization of the Gelling Process in Acidifying Milk by Diffusing Wave Spectroscopy
Related Product
DWS RheoLab™
The DWS RheoLab™ is a contact-free rheometer. It provides access to the sample's viscoelastic properties over an unmatched frequency range and enables the study of textures and microstructures while requiring only small sample volumes.
Introduction
Diffusing Wave Spectroscopy (DWS) is a powerful optical technique to study the microrheological properties of viscoelastic samples [1]. It is based on the analysis of the fluctuations of light that has been scattered multiple times within a sample. Because DWS inherently averages over all scattering events, it can yield valuable information even on highly complex systems, such as milk or paint [2,3]. The DWS ResearchLab (model before the current DWS RheoLab) of LS Instruments is a versatile tool to conduct such DWS measurements in both transmission and backscattering mode. The patented DWS echo-technology reduces the usual DWS measurement time significantly and thus typical measurements take as little as one minute compared to hours, enabling the study of a wide range of samples that evolve in time. All measurements in this application note were conducted with the DWS ResearchLab.
The yoghurt-Making Process
Milk is probably the most studied natural colloidal system. It consists of a continuous water phase, in which dispersed fat droplets are stabilized by milk proteins. The latter include nanometer-sized whey proteins, like β-lactoglobulin, and caseins, which are 100-400 nm in size and constitute 80% of milk protein.
Yoghurt is a fermentation product of milk; lactic-acid bacteria convert lactose into lactic acid, which results in a lowering of the pH towards the iso-electric point of the caseins. Once the casein proteins start to lose their charges, they start to aggregate: the sample gels to form yoghurt! In the laboratory, this process is mimicked by adding glucono-δ-lacton, which slowly dissociates, and thus gradually lowers the pH as shown in Figure1.

Figure 1. pH decrease in time for milk mixed with 0.6 wt% glucono-δ-lacton.
Non-ergodicity
A central parameter in DWS data treatment is the transport mean free path, l*. It is a measure of the length scale in the system over which the direction of scattered light is fully randomized. Thus the inverse of l*is a measure for the turbidity of the system. Because l* is hard to determine without a detailed knowledge of the sample properties, we extract it from a comparison of the transmitted intensity, TI, to that of a known reference sample containing 1 wt% of polystyrene particles (r= 200 nm) in water (Eqn. (1)):
Milk is a liquid in which the scattering objects can freely move. This yields a scattered signal which is automatically time averaged over several microscopic configurations of the sample: it is ergodic. In yoghurt the proteins and fat droplets form a network, which effectively does not change over the time span of a measurement. We call such samples non-ergodic and the resulting transmitted intensity signal will strongly depend on the exact position of the detector. The DWS ResearchLabuses a spinning ground glass to counteract this effect (Figure 2). It thus allows DWS measurements not only on milk but also on yoghurt [4].

Figure 2. Transport mean free path, l*, for acidifying milk determined with the regular DWS (open symbols) and with a rotating ground glass (closed symbols).
Qualitative information from the correlation function
The DWS ResearchLabmeasures the dynamic sample properties in the form of normalized intensity correlation functions, g2(t)-1. Here the ground glass is employed in a second, different way. Using the patented DWS echo technology correlation times up to 12 s can be measured much faster than usual (within minutes instead of hours). The correlation function obtained with the echo technology is pasted to the regular correlation function, thus extending the actual measurement range and yielding a more discrete correlation function as highlighted in Figure 3.
Acidifying milk shows the typical dynamic behavior of a gelling process: The correlation function shifts to longer times (see arrow in Figure 3), indicating a reduction of the dynamics. At the lowest pH values the correlation function no longer fully decays to zero due to the scatterers being trapped in the space-spanning yoghurt network.
The shift to longer decay times can be quantified by the time at which the correlation function has decayed to half its initial value. Indeed the half time, plotted in Figure 4 as a function of decreasing pH, remains almost constant down to a pH of 5.2, which corresponds to the onset of aggregation. It then gradually increases over several orders of magnitude.
Although the actual gel point cannot be directly determined from the half time, it can be taken as a measure for process optimization and regulation. This is for instance applied in cheese making, where the gelling curd has to be cut once it has achieved a specific consistency.
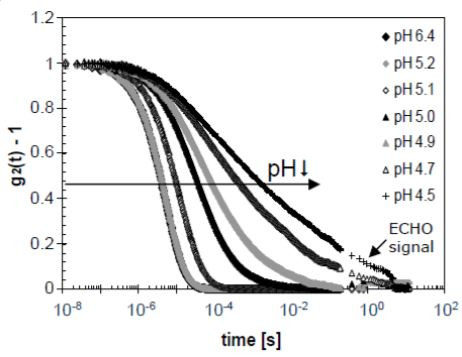
Figure 3. Correlation functions of acidifying milk measured in time. The curves are labelled with their decreasing pH values.
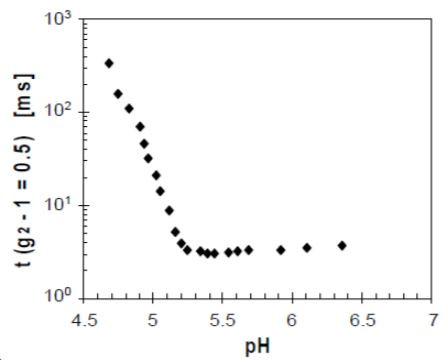
Figure 4. Times at which the correlation function has decayed to half its value as a function of decreasing pH for acidifying milk.
Quantification of the gel-point
The software package of the DWS ResearchLabautomatically extracts the mean square displacement, <Δr2(t)>, from the measured correlation function g2(t). This is a measure for the space within the sample that the scattering particles explore in a given time.
If the scatterers are sufficiently monodisperse and if they are not part of the overall network, one can relate the mean square displacement to the rheological quantities G’ and G”, the elastic and the viscous modulus respectively. Obviously, yoghurt or milk do not obey these requirements. However, even if we are limited to the mean square displacement in this specific case, we nevertheless gain valuable information about the sample.
For samples that show a fully decaying correlation function, the accessible time window is limited by the dynamics of the scatterers and the effective turbidity, which can be expressed as L/l*, where L is the thickness of the cell. By using two different samples cells with L=5 mm (symbols) and L=2 mm (lines) we explore up to seven orders of magnitude in time, as shown in Figure 5. Upon lowering the pH we see a slow down of the dynamics in the system: the slope and the absolute value of the mean square displacement decrease. A pseudo-plateau develops at longer times (Figure 6).

Figure 5. Mean square displacement of milk at pH 4.95 measured with DWS in a 5 mm (symbols) and a 2 mm cell (line).
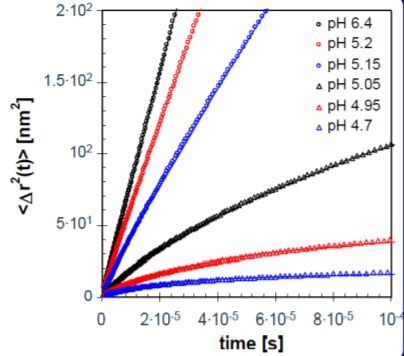
Figure 6. Mean square displacements for acidifying milk at various pH values (legend), including fits of Eq. 2 (lines) to the data.
The experimental data in Figure 6 are fitted with a stretched exponential (Eqn. 2):
where δ is related to the free space per scatterer in the aggregated network, is the characteristic relaxation time, and p an indication of how diffusive the motion of the scatterers is [5,6].
Approaching the isoelectric point of casein (pH ≈ 4.6) both the proteins and the protein-stabilized fat droplets start to aggregate. When the aggregates become space-spanning, the sample gels to form yoghurt. To characterize this point, we follow the exponent p determined from the fits in Figure 6 with decreasing pH, as summarized in Figure 7. For liquids, the mean square displacement linearly increases with time, which corresponds to p = 1. This is clearly the case for fresh milk with a pH around 7.

Figure 7. Parameter p as a function of decreasing pH for acidifying milk.
The onset of aggregation concurs with the decrease ofp at pH 5.2, which agrees well with the qualitative picture obtained from the half time of the correlation function in Figure 4. For particle gels, the gel point is defined as the moment where p drops below 0.7 [5,6]. Thus, we determine the gel point of acidifying milk at pH ≈ 4.9.
References
[1] D.A. Weitz, and D.J. Pine, Diffusing-Wave Spectroscopy. In Dynamic Light Scattering; Brown, W., Ed.; Oxford University Press: New York, 652-720 (1993).
[2] M. Alexander, and D.G. Dalgleish, Diffusing Wave Spectroscopy of aggregating and gelling systems, Current Opinion in Colloid & Interface Science 12, 179-186 (2007).
[3] H. Ruis, K. van Gruijthuijsen, P. Venema, and E. van der Linden, Structure-rheology relations in sodium caseinate containing systems, Langmuir 23, 1007-1013 (2007).
[4] P. Zakharov, F. Cardinaux, and F. Scheffold, Multispeckle Diffusing-Wave Spectroscopy with a Single-Mode Detection Scheme, Physical Review E 73, 011413 (2006).
[5] A.H. Krall, and D.A. Weitz, Internal dynamics and elasticity of fractal colloidal gels, Physical Review Letters 80, 778-781 (1998).
[6] S. Romer, F. Scheffold, and P. Schurtenberger, Sol-Gel Transition of Concentrated Colloidal Suspensions, Physical Review Letters 85, 4980-4983 (2000).