
Multi-Angle DLS - Characterizing the Size Distribution of an Highly Polydisperse Model System
Related Product
LS Spectrometer™ II
The LS Spectrometer™ II is a Variable Multi-Angle Light Scattering (V-MALS) instrument for the most comprehensive nanoparticle characterization.
Introduction
Dynamic Light Scattering (DLS) is the technique of choice to determine the size of colloids and nanoparticles in suspension or polymers in solution. DLS measures the normalized intensity correlation function, which characterizes the scattered intensity fluctuations at a given scattering vector modulus [1]
,
where is the scattering angle, n the refractive index of the suspending medium, and
the wavelength of the incident light. The particle size is extracted from the electric field correlation function,
obtained form
by means of the Siegert relationship:
where A is an instrument dependent constant of order one. A straightforward interpretation of the correlation function in terms of particle size is possible for samples having a narrow size distribution. For those samples and under single-scattering conditions, the correlation function is well represented by a single exponential having a decay rate , where
is the particle’s diffusion coefficient. Under dilute conditions, the hydrodynamic radius the hydrodynamic radius, which represents the DLS size and is defined as the radius of the sphere having the same diffusion coefficient of the particle in question, is then calculated using the Stokes-Einstein relationship as
, where η is the solvent viscosity, kB is the Boltzmann constant and
is the temperature. This is the basis of DLS particle sizing [1].
The interpretation of the correlation function is, however, less straightforward for systems having a broad distribution of particles sizes. Indeed, the correlation function becomes a sum of exponentials:
(1)
where is the intensity-weighted distribution of diffusion coefficients associated with the distribution of particle sizes. The measured correlation function not only departs from a single-exponential decay in particular at longer correlation times but moreover some particles sizes might also be “invisible” due to their weak scattering at specific
.
In this application note, we illustrate the intensity-weighted contribution to the correlation function at different specific measured in DLS experiments using a bimodal mixture of spheres as model polydisperse system.
Results and Discussion
We prepare two separate suspensions of silica spheres (microParticles GmbH®, Sample A: 2R = 402 nm SiO2-R-L1914 and Sample B: 2R = 235 nm SiO2-R-B930) dispersed in water and having a weight fraction of 0.0125 mg/mL each. The scattered intensities and
of the pure samples are measured using the 3D LS Spectrometer from LS Instruments, and the results are presented in the left panel of Figure 1. Note that we normalize the data by the incident laser power in order to make the scattered intensities of the two samples comparable. Also present in Figure 1 is a Mie fit to the data yielding a radius of 195 nm (PDI = 4%) and 118 nm (PDI = 6%) for sample A and B, respectively. These results are in good agreement with the manufacturer’s specifications.
Using the same batch of silica spheres, we prepare a binary mixture having the same final concentration of 0.0125 mg/mL for each of the particle species. In this special case, the scattering intensity of the mixture is simply the sum of the intensities measured earlier for sample A and B. This is illustrated in the right panel of Figure 1, where we show the measured scaled scattering intensity of the mixture, which is perfectly modelled, by the sum of the Mie fits shown in the left panel.
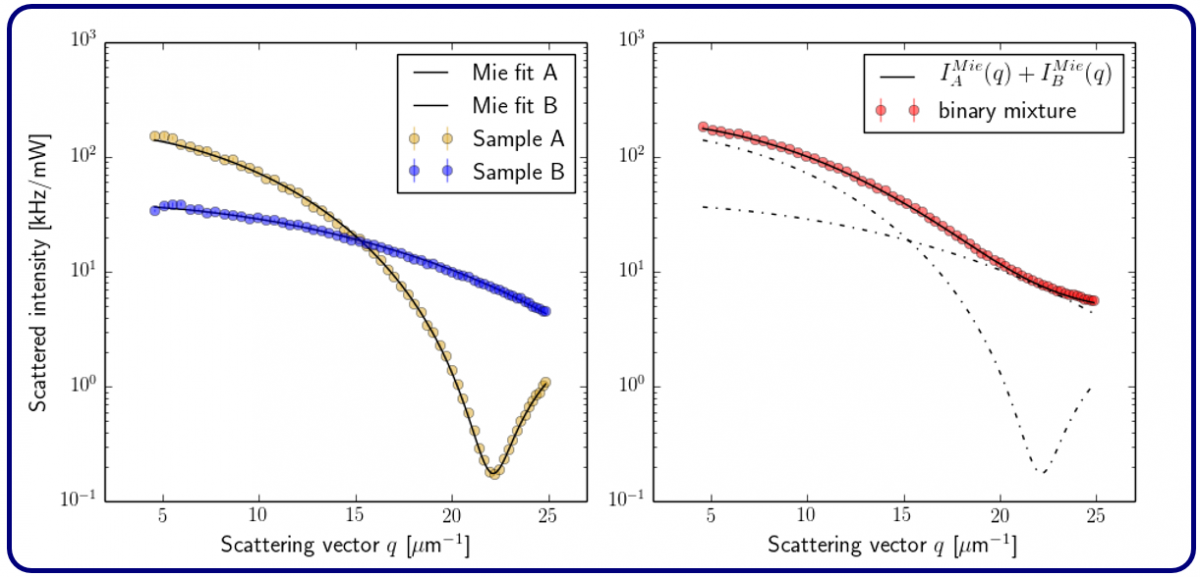
Figure 1. (Left): Scattered intensities from samples A and B as a function of scattering vector q. The lines are Mie fits the data yielding a size of RA=195 nm and RB=118 nm. (Right): Scattering intensity of the binary mixture. The dashed lines are the results of the Mie fits from sample A and B shown in the left panel, and the line is their sum.
We now turn to the dynamics of the binary mixture. We observe that the initial decay of the measured correlation functions for the mixture is close to single exponential and we use the method of cumulants to fit the data [2]. The resulting apparent radius R(q) derived from the first cumulant of the fit is presented in Figure 2. The dependence of the radius with q follows Eq. 1; the contribution of the particles of a given size to the decay of the correlation function is weighted by the relative intensities scattered by particles A and B. For example at , is almost two orders of magnitude larger than and the measured size of the mixture is, therefore, closer to the size B. The measured diffusion coefficient can be modelled using the first moments of the two samples’ monomodal particle distribution. This amounts to assuming that
in Eq. 1 is the sum of two sharp peaks. We thus obtain for the binary-mixture:
(2)
where . The dashed line in Figure 2 shows the prediction of Eq. 2, where we used the intensities measured for the pure samples and the size obtained from the Mie fits to calculate
. This simple model is in excellent agreement with the DLS results.
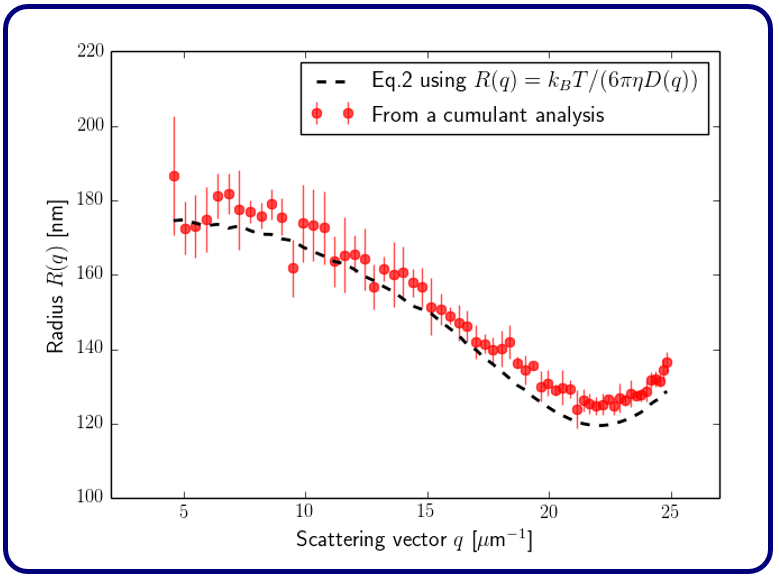
Figure 2. Hydrodynamic radius obtained from a 1st cumulant analysis of the DLS data for the binary-mixture. The dashed line is the prediction from the simple model of Eq. 2.
Conclusions
The effect of studying multimodal or polydisperse mixtures on DLS particle sizing has been studied using a binary mixture of spheres having two different sizes as a model system. We show that while the method of cumulants gives consistent fit results, the interpretation of the measured radius requires knowledge of the relative intensity scattered by each size-species. This is a direct consequence of the intensity-weighted contribution of each species to the correlation function (cf. Eq (1)). For sizing purposes, it is therefore recommended to initially perform test measurements at different scattering vectors by changing the scattering angle and observe if the results of the cumulants analysis are consistent. The observation of a q-dependence of the radius is a strong indication for the polydisperse nature of the sample. In this alternative methods of analysis must be considered. In particular, an (multi-angle) inverse Laplace transformation of the correlation function known as CONTIN analysis provides more accurate information for the sizing of polydisperse systems [3,4].
References
[1] P. Linder, T. Zemb, Neutrons, X-rays and Light: Scattering Methods Applied to Soft Condensed Matter, Elsevier, North-Holland Delta Series (2002).
[2] D.E Koppel, Analysis of Macromolecular Polydispersity in Intensity Correlation Spectroscopy: The Method of Cumulants, J. Chem. Phys 57 (11), 4814-4820 (1972).
[3] S.W. Provencher, A constrained regularization method for inverting data represented by linear algebraic or integral equations, Comput. Phys. Commun. 27, 213 (1982).
[4] A powerful multi-angle inverse Laplace transformation routine with a modern user interface is currently being developed at LSInstruments. For updates please check regularly at www.lsinstruments.ch or contact info@lsinstruments.ch.