
Characterizing the Dispersion Quality of Inks with the NanoLab 3D
Related Product
NanoLab 3D™
The NanoLab 3D™ is a compact DLS instrument for particle sizing that is based on the groundbreaking and patented Modulated 3D Cross-Correlation technology. It efficiently suppresses multiple light scattering and therefore sample dilution is no longer required for most samples.
Abstract
The dispersion quality of pigment inks greatly influences their final key properties such as color strength or rheological behavior. Dynamic Light Scattering (DLS) particle sizing provides a fast and in-situ approach to characterize such dispersions. In this application note, we report measurements performed on two commercial and undiluted samples of pigment inks prepared under different conditions. The use of the Modulated 3D cross-correlation DLS technology guarantees reliable measurements, even for such highly concentrated systems. We also highlight the need for sufficient laser power due to light absorption by the ink system. The results evidence a clear dispersion quality difference between the two samples, demonstrating the great efficacity of advanced DLS to characterize pigment ink dispersions.
Introduction
Pigment printing is nowadays the most extensively used technique for printing textile, due to its easy application to a variety of fabrics and relatively environmentally friendly aspects. Pigment inks have a much higher color strength and stability than dye-based inks but are typically challenging to disperse in a solvent.
Accidentally, it is exactly the dispersion quality that influences the final color result. The color strength of a pigment depends on its exposed surface area, and the smaller the particle, the higher the surface area and thus stronger the color [1,2]. Also, large aggregates can clog nozzles or channels during inkjet printing. It is thus crucial to reliably assess the pigment particle size and polydispersity to predict the performance of the final product.
These parameters must be reliably measured and controlled using appropriate equipment at all stages during the development and production process. Dynamic Light Scattering (DLS) is widely used as a technology to determine the particle size and particle size distribution of dispersed nanoparticles due to the simple, fast, and non-destructive measurement principle. However, standard DLS is often unreliable for such concentrated samples in which multiple scattering occurs. The Modulated 3D technology [3], patented by LS Instruments, provides a reliable way of performing DLS particle sizing with no artifacts arising from multiple scattering, thus enabling reliable characterization of such challenging systems.
In this application note, we show how to reliably and rapidly assess the dispersion quality difference between two inks, using an error-free DLS technology. The results may apply to a wide range of concentrated systems.
Material & Instrumentation
The measurements were performed on two commercial, UV-curable monomer-based pigment dispersions, labeled “Sample 1” and “Sample 2”, with comparable solid contents. A picture of the samples is shown in Figure 1. The preparation of these samples was done through ball milling, whereby the solid pigment particles are dispersed in the monomer solution, utilizing steel balls to chop up the pigment particles and disperse them thoroughly. A different steel ball size was used in each ink and thus the resulting dispersion quality is expected to differ. The samples were measured without any dilution, nor filtration.
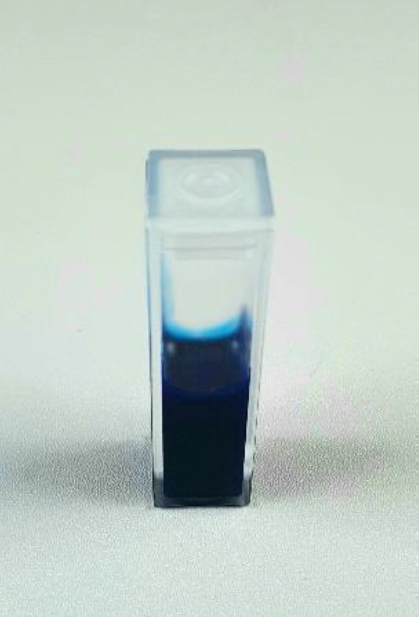
Figure 1: Photograph of Sample 1 loaded in a cuvette.
Measurements were conducted on a NanoLab 3D from LS Instruments equipped with a 120 mW Laser at a 638 nm wavelength at a temperature of 25°C. Measurements were performed with the Modulated 3D technology activated to remove any undetectable errors arising from multiple light scattering. Each measurement consists of 5 repetitions of 120s. The scattering angle is fixed at 90° in this instrument. The laser intensity was set automatically through the software to reach a sufficient count rate during each repetition.
Results
Laser Intensity
The first parameter allowing the assessment of the difference between the two ink samples is the scattering intensity, scaled to the incident laser intensity. The resulting scattered intensities for both samples are reported in Table 1:
|
|
Sample 1 |
Sample 2 |
|
Intensity (kHz/mW) |
2060 |
0.697 |
|
Percentage Variation (%) |
14.6 |
40.1 |
Table 1: Comparison of the average scattered intensity measured on both samples and its variation among the 5 repetitions performed.
These first results evidence a much lower scattering intensity in Sample 2 than in Sample 1. We note the measured count rate was 50kHz and the laser intensity required to reach this value was more than 80 mW. Such samples are typically problematic to measure with DLS because of the high laser power required to obtain a sufficient signal. While the NanoLab 3D features an available laser power of 120 mW, such a measurement would be fairly compromised on a standard DLS instrument, in which the maximal laser power typically does not exceed 10 mW. Considering for example the scaled count rate of Sample 2, a count rate of a maximum of 7 kHz would be obtained with a standard DLS device. Such a low count rate becomes comparable to that of the background noise (“dark counts”) of the detectors and in consequence, the measurement duration must be significantly increased to yield a DLS signal of sufficient quality. This first observation highlights the importance of laser intensity when conducting DLS measurements on such complex and potentially absorbing systems. More discussion on the importance of laser intensity in DLS can be found in a 2018 publication that appeared in Pharmaceutics [4].
Count rate trace
Observing the count rate trace of a DLS measurement is an appropriate and rapid way of gaining valuable information on the nature of the sample. A portion of the count rate traces of both samples is presented in Figure 2.

Figure 2: count rate trace for (a) Sample 1 and (b) Sample 2 for a representative repetition
Sample 1 shows a smooth count rate trace with a standard deviation below 20%, characteristic of a well dispersed and homogeneous suspension. On the other hand, the count rate trace for Sample 2 shows significantly higher fluctuations – more than 40% on average - with frequent, large intensity spikes. This suggests the presence of several size populations in the suspension and is a typical pattern of a poorly dispersed sample. This first observation hence directly indicates a lower dispersion quality in Sample 2 than in Sample 1.
Correlation Function
The intensity correlation functions (ICFs) are reported in Figure 3. They were rescaled to 1 for better comparison among the 5 repetitions performed. A minor intercept variability, with no consequence on the measurement quality, was observed. This is expected for such colored and opaque samples, as a portion of the signal is lost due to light absorption. It is also partially due to the high concentration of the samples, as any multiple scattering signal is suppressed.
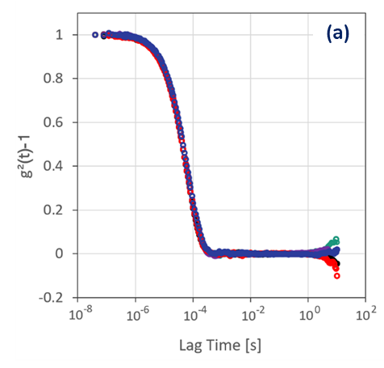
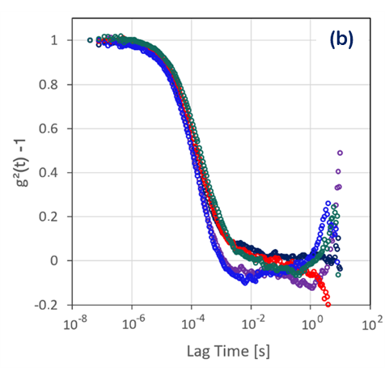
Figure 3: ICFs measured in (a) Sample 1 and (b) Sample 2.
Sample 1 shows an excellent reproducibility among all repetitions performed. The single decay of the ICF, as well as its smooth baseline, indicates the absence of large aggregates. On the other hand, the data acquired on Sample 2 is not reproducible. The ICFs decay times are shifted to higher lag times and all repetitions display a noisy baseline. Both of these observations indicate a system with high polydispersity and the presence of aggregates.
Particle Sizing
The excellent reproducibility on the ICFs obtained from Sample 1 allows for straightforward particle sizing. In Figure 4, a representative volume-weighted particle size distribution obtained from a CORENN fit is displayed, while table 2 compares the averaged results obtained with the Cumulant or CORENN method. CORENN [5] is a novel advanced machine learning algorithm to extract the particle size distribution (PSD) from a DLS measurement. It leverages advanced signal approximation techniques and a unique theoretical estimate of the signal noise, yielding reliable results that are robust against experimental distortions.

Figure 4: Volume-weighted particle size distribution of a representative repetition acquired on Sample 1.
|
|
Cumulant |
CORENN |
|
Average |
16.58 |
16.60 |
|
PDI |
0.70 |
0.84 |
Table 2: Particle size and polydispersity index results obtained from the Cumulant and CORENN fitting algorithms.
The results are extremely consistent between the two fitting algorithms. The size distribution is monomodal, with a polydispersity index of 0.84, and no larger objects are identified. The sizing results thus confirm the excellent quality of the dispersion for Sample 1.
The lack of reproducibility observed for Sample 2 in 2.3 does not allow for reliable particle sizing. However, we note that larger objects are detected in several repetitions, which echoes the observations made in the previous sections. The preparation method thus has an enormous impact on the final properties of these pigment dispersions.
Conclusion
The dispersion quality of two ink samples of similar solid content was characterized by means of next-generation DLS, using the NanoLab 3D particle sizer with the Modulated 3D technology. A significant difference in the scattering intensity and correlation signal could be observed among the two samples. This was sufficient to draw reliable conclusions on the dispersion quality in both samples: we assess the dispersion quality as excellent in Sample 1, while that of Sample 2 is mitigated by a high polydispersity and the presence of some aggregates in the suspension. DLS particle sizing could be reliably conducted on Sample 1, confirming the dispersion quality through a narrow, monomodal particle size distribution. DLS is thus an excellent method to characterize the dispersion quality of a sample, as it provides a fast and in-situ approach. Most importantly, high laser power was crucial in the characterization of these complex systems.
References
[1] B. Thompson, Printing Materials: Science and Technology, PIRA, p. 329-330 (1998).
[2] A. Frimova et al., Ink Stability During Printing, TAGA J., 2, 2005
[3] I. Block et al., Rev. Sci. Instrum. 81, 123107 (2010).
[4] S. Aleandri et al., Pharmaceutics, 2018 Jul 17;10(3):94.
[5] https://lsinstruments.ch/en/technology/dynamic-light-scattering-dls/corenn