
Modulated 3D Cross-Correlation DLS: Exploring Sample Turbidity Limits
Related Product
LS Spectrometer™ II
The LS SpectrometerTM II is a goniometer-based variable-angle light scattering instrument for static- (SLS) and dynamic light scattering (DLS). The LS SpectrometerTM II allows for the most comprehensive nanoparticle characterization and can be further upgraded with various options, such as Modulated 3D technology for the measurement of turbid samples.
Introduction
Dynamic light scattering (DLS) is a widely used technique for the determination of solution-based particle and polymer size distributions. In particular, it has become an industry standard for sizing nanoparticles in the range of several nanometers to several microns. The wide acceptance of DLS for particle sizing stems from the simple, fast and non-contact measurement procedure for generating particle size distributions. Unfortunately, the autocorrelation function which is the measured quantity in standard DLS is susceptible to contributions from multiply-scattered light. Unless only light which has been scattered by the sample exactly once is measured, an accurate DLS analysis cannot be performed. Currently, no method exists which can be applied to autocorrelation measurements having multiple-scattering contributions to correctly determine sample size distributions or even robustly determine the presence of multiple scattering. Strong sample dilution is, therefore, a strict requirement for standard DLS measurements.
For accurate measurements in concentrated samples and improved confidence in all cases, another strategy must be adopted. LS Instruments offers 3D cross-correlation technology that enables the measurement of highly scattering samples by extracting only the singly scattered light from the detected signal. The sample turbidity limit for the technique occurs at the point at which so few singly-scattered photons are available for analysis that they are overwhelmed by the experimental noise floor. The recently developed modulated 3D cross-correlation technique has further improved the signal integrity of the cross-correlation method. However, the question remains as to exactly how such an improvement translates to DLS measurement precision and furthermore what are the ultimate limitations for a typical particle sizing application. In this application note, we explore the influence of sample turbidity and sample optical path lengths on DLS measurement quality.
DLS measurements
Figure 1 shows correlation functions measured for a dilute monodisperse solution of 110 nm diameter polystyrene spheres at a scattering angle of 90-deg. Shown are correlation functions captured in three operational modes: standard autocorrelation (normal DLS), 3D cross-correlation, and the recently released modulated 3D cross-correlation mode [1]. The correlation function is the starting point for all dynamic light scattering analyses. For particle sizing applications, the nuances of the curvatures contained in these data ultimately yield a particle size distribution by way of mathematical transformations. It should be apparent then that the quality of this starting data is of the utmost importance for precise data analysis. Under the assumption of sufficient photon statistics (determined by the product of photon counts at the detectors and the measurement duration), the magnitude of the correlation function (measured by its y-axis intercept) will determine the measurement quality for a given sample at a given scattering angle. Here we see that the modulated 3D cross-correlation intercept magnitude is drastically improved from standard 3D cross-correlation and approaches the magnitude of the autocorrelation function.

Figure 1.Correlation functions and single-exponential fits for 0.001 wt% 110 nm polystyrene sample.
For cross-correlation, the intercept will fall in the presence of multiple scattering and approaches zero as a negligible amount of singly scattered light remains. In fact, the intercept of a given measurement relative to the dilute case provides a direct quantitative measure of what percentage of the detected photons have been singly-scattered and are thus amenable to analysis. Figure 2 shows the trend in the magnitude of the cross-correlation function (ie intercept) versus sample mean-free-path for varying optical path lengths through the sample. The mean-free-path is a measure of the average distance between scattering events.

Figure 2. Cross-correlation intercept as a function of sample mean-free-path, total optical path-length through the sample, and correlation mode. Lines are plotted as a guide for the eye.
Total sample path-lengths below 5mm are achieved using a square sample cell and the LSI Gen2 Sample Goniometer. As expected, it is seen that for shorter optical path lengths, the intercept for a given sample is higher indicating the reduced presence of multiple scattering. We also see that the modulated 3D technique effectively provides a vertical scaling from the 3D cross-correlation data and enables the measurement of a non-zero intercept for more turbid (lower mean-free-path) samples.
While the data are particular to the 110nm polystyrene sample, approximately equivalent results are expected for small particles (ie Rh< 150nm) which exhibit relatively isotropic scattering over the accessible scattering angle range. Larger particles (ie Rh> 150nm) which scatter light highly anisotropically will follow the same qualitative trends but will exhibit a mild angular-dependence in intercept in accordance with the particle form factor.
Given a trend between intercept and mean-free-path, we can directly link these parameters with DLS measurement quality. As a simple metric of measurement precision, Figure 3 presents the standard deviation of the mean hydrodynamic radius Rh calculated (using a second order cumulant fit) from repeated (N=8) 60s DLS measurements.

Figure 3. Standard deviation of calculated Rhfor repeated measurements (N=8) of 110 nm polystyrene.
The trend shows the improved measurement quality accessible at higher intercepts using the Mod3D cross-correlation mode which in the dilute limit, effectively approaches that of autocorrelation measurements. It is also apparent that a lower limit on the minimum usable cross-correlation intercept exists at ~0.05 in this particular case if we define the cut-off as <10% deviation of Rh. By defining such a limit and revisiting Figure 2, we see that the combined use of modulated 3D cross-correlation and the LSI 2ndGen Upper Goniometer enables measurement of samples with mean-free-paths an order of magnitude lower than that achieved without these features.
To further illustrate the role of the cross-correlation intercept in determining DLS measurement quality, Figure 4 presents particle size distributions (mean and standard deviation for 8 measurements) calculated using CONTIN, a popular Laplace inversion algorithm particularly suited for determining particle size distributions [2]. For the case of a dilute sample, measurements in auto- (Figure 4a) and modulated 3D cross-correlation (Figure 4b) yield nearly equivalent result, as should be expected. However, when measuring a highly turbid sample we see the failure of the autocorrelation measurement in Figure 4c with characteristic ‘ghosted’ peaks at smaller size that result from higher order scattering. Figure 4d displays the CONTIN results for the same turbid sample measured with modulated 3D cross-correlation. While the very low intercept (b=0.04) leads to a slight broadening and predictably increases the variability of the calculated particle size distribution as compared to the dilute measurement case, the average result nonetheless remains robust.
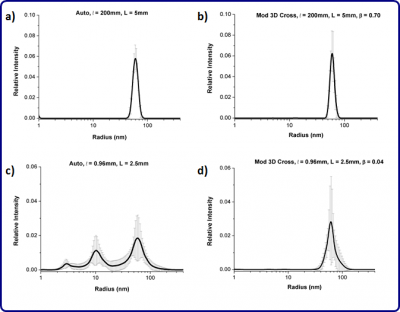
Figure 4. Particle size distributions (mean and std. dev., N=8) generated using CONTIN for dilute (a-b) and turbid (c-d) 110 nm polystyrene particle suspensions measured in autocorrelation (a,c) and Mod3D cross-correlation (b,d).
Conclusion
In this application note, we have sought to provide a direct link between a sample’s mean-free-path and the quality of DLS measurements which can be performed in one of several configurations of the LS Spectrometer. To do so we have determined the cross-correlation function magnitude (or intercept) as a function of sample mean-free-path. We have then related the intercept to DLS analysis quality in two ways: by calculating the repeatability of mean hydrodynamic radius measurements as a function of intercept; and calculating particle size distributions for two limiting cases of a very turbid and a dilute sample. We have shown that while measurement precision decreases as the cross-correlation intercept is reduced, accurate and reliable results can nonetheless be obtained for intercepts as low as ~0.05. Furthermore, we have demonstrated the failure of autocorrelation measurements to produce an accurate particle size distribution for a turbid sample.
Our analysis was based on fixing measurement duration, scattered intensity, and correlation times included in the analysis. By doing so we have attempted to directly show the importance of the cross-correlation function magnitude on DLS measurements. However, we must emphasize that the overall quality of the correlation function will also depend on the aforementioned parameters [3].
References
[1] I. D. Block and F. Scheffold, Modulated 3D cross-correlation light scattering: Improving turbid sample characterization, Review of Scientific Instruments 81,123107 (2010).
[2] Stephen W. Provencher, Inverse problems in polymer characterization: Direct analysis of polydispersity with photon correlation spectroscopy, Macromolecular Chemistry and Physics 180 (1), 201-209 (1979).
[3] Klaus Schätzel, Correlation techniques in dynamic light scattering, Applied Physics B, 42(4) (1987).