
Characterization of Macromolecules in Solutions - Zimm Plot
Related Product
LS Spectrometer™ II
The LS SpectrometerTM II is a goniometer-based variable-angle light scattering instrument for static- (SLS) and dynamic light scattering (DLS). The LS SpectrometerTM II allows for the most comprehensive nanoparticle characterization and can be further upgraded with various options, such as Modulated 3D technology for the measurement of turbid samples.
Introduction
Static light scattering (SLS) is a powerful method routinely used by chemists, biochemists, and molecular biologists to characterize macromolecules in solutions. From a concentration-dependent series of absolute scattering measurements, one can obtain information about the molecular weight M, radius of gyration Rg, and second virial coefficient B2 of macromolecular systems, such as polymers, aggregates of surfactant molecules or proteins.
In this application note, we present the "Zimm plot", a convenient method to analyze SLS data. It is applied to a series of measurements at different scattering vector modules q1
where n is the refractive index of the solvent, θ is the scattering angle and λ is the wavelength of the scattered light. At each scattering vector, several dispersion dilutions of polystyrene chains in toluene are measured.
Absolute scattering and Zimm plot analysis
Outline of the theory
The ability of a solution of macromolecules to scatter light is characterized by the Rayleigh ratio R (i.e. the time average scattering intensity per unit solid angle, unit scattering volume and unit illumination intensity). The Rayleigh ratio is a measure of the absolute scattering of the sample and includes contributions from both the solvent and the macromolecules. In order to obtain the latter contributions, referred to as the excess Rayleigh ratio Rex, an additional measurement of the pure solvent scattering (Rsol) is necessary, yielding Rex=R-Rsol. The excess Rayleigh ratio contains information about the mass, size, and structure of macromolecules in solution, and is a function of both the concentration and the scattering vector q:
where M is the weight-average molecular mass, K is an optical constant, P(q) is the molecule form factor, and S(q)is the structure factor. Analytic expressions for P(q) and S(q) can be obtained in the limit of qRg<<1 and small concentration w. Using the suitable expansions and rearranging the terms in equation (1) yields the following expression:
where ,
is the Avogadro number, and B2 is the thermodynamic second virial coefficient.
Constructing a Zimm plot from SLS data
A convenient way to extract Rg, M, and B2 from a series of SLS measurements by application of equation (2) is the so-called Zimm plot. It is a schematic representation which linearizes the q2-dependence of Rex while separating the dependence on q and w by plotting Kw/Rex(q,w) versus q2+cw, where c is a constant to be chosen arbitrarily. The intercept of a linear interpolation at fixed q, therefore, yields an inverse molecular weight, while the slope is proportional to the second virial coefficient. Similarly, the radius of gyration is obtained by linear interpolation of the Zimm plot at a fixed concentration.
To illustrate the Zimm plot method, we performed SLS measurements on dilute solutions of polystyrene chains dispersed in toluene. We measured at a temperature of 25°C using a 3D LS Spectrometer. The results are presented in Figure 1 for various concentrations and scattering vectors, together with the linear interpolations. Data fitting is performed using the LSI Zimm plot software. Developed by LS Instruments, this software allows for automatic computation of the molecular weight, the radius of gyration, and the second virial coefficient using a robust global fitting procedure. Thus once the experimental data was obtained, the entire computation was done by LSI Zimm plot software. We obtained a molecular weight of 1.15x10⁶g mol-1, which is very close to the nominal value of 1.10x10⁶g mol-1 provided by the manufacturer (Sigma-Aldrich, ref#81416). Additionally, we obtained a radius of gyration of 43 nm and a second virial coefficient of 390 cm3g-1, consistent with the chain conformation expected for this well-documented model system.
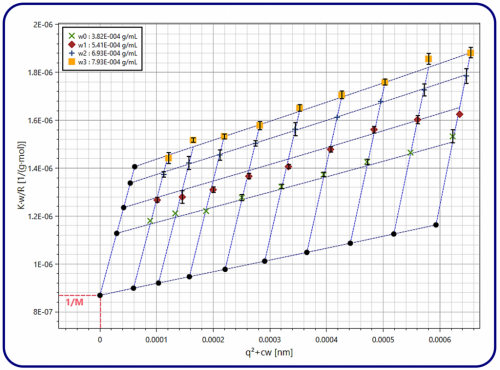
Figure 1. Zimm plot of scattering data for four different concentrations of polystyrene chains dispersed in toluene and measured at a temperature of 25°C. The data is presented in color, while the extrapolations of the global fit to q=0 and w=0 are shown as black dots.
This application note demonstrates the power of static light scattering for the characterization of macromolecules in solutions, which in our case was a model polymer solution. Additionally, we illustrated the ease of applying Zimm plot analysis using the LSI Zimm plot software, which provides a user-friendly interface and robust fitting routines to determine the molecular weight, radius of gyration and second virial coefficient of macromolecular systems.