DLS Data Analysis: The CORENN Method
LSI has developed a novel advanced machine learning algorithm called CORENN to extract the particle size distribution (PSD) from a DLS measurement. CORENN addresses weaknesses of CONTIN or CUMULANT analysis and similar approaches by means of four cornerstones:
- solution of the non-linear inverse integral equation
- robust and fast theoretical estimate of the correlation function noise
- advanced criteria for the selection of the correct solution
- advanced signal approximation techniques
these advanced features have led to an extremely reliable algorithm, robust against experimental distortions, and able to predict more reliably the true PSD for a real-world DLS experiment.
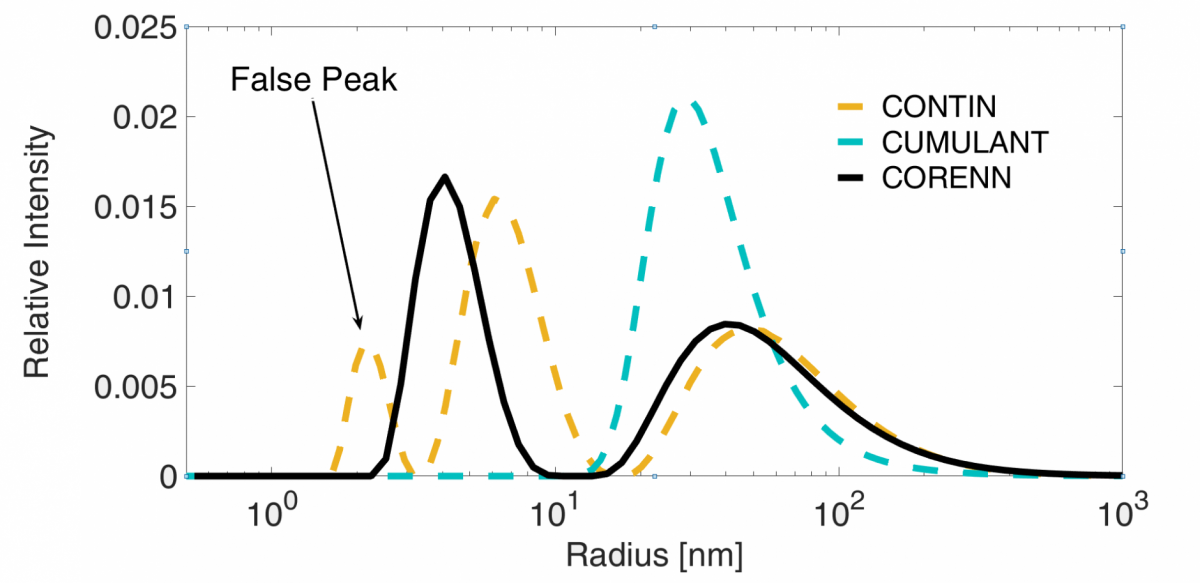
Only CORENN obtains the correct results for a bimodal particle distribution with a typical level of noise in the DLS data.
Introduction
Colloidal particles (or nanoparticles) play a crucial role in many industries such as food, pharmaceutics, biotechnology, life-science, or paint industry. Typical physical properties are:
- diameter < 1 micron in the dispersed phase
- extremely high surface to volume ratio,
- heterogeneity despite the homogenous appearance
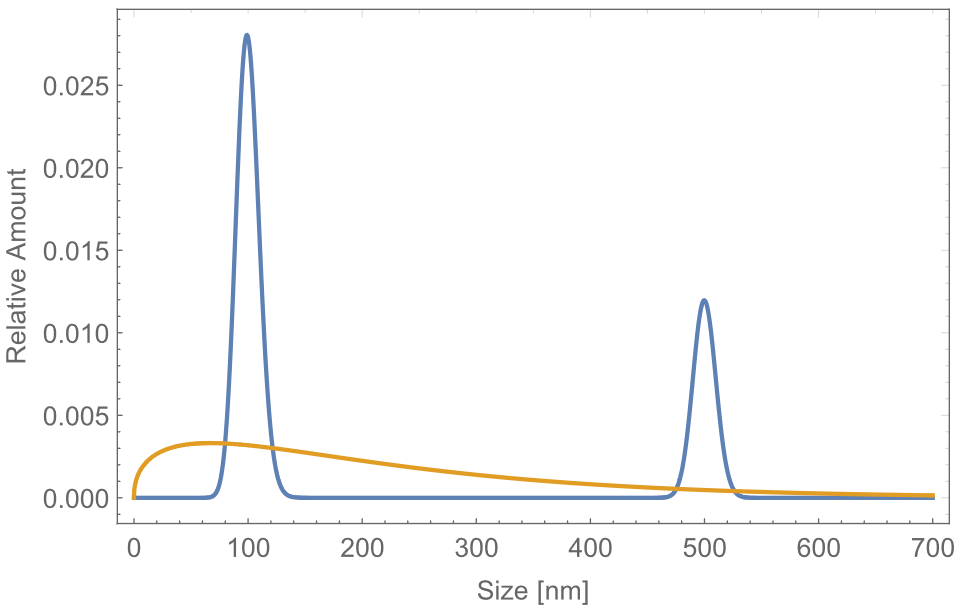
The key property governing all other physical properties is the particle size distribution. For this reason, tools to measure the size distribution are among the most important to study colloids. Basic particle sizing tools normally provide information about the size distribution in terms of one or at best two quantities such as the average size and width of the distribution. This is in many cases not sufficient to fully characterize and understand a colloidal system. As an illustrating example take a lipidic nanocarrier system. It is known that their performance is strongly affected by the available surface to volume ratio of the nanocarriers. The surface to volume ratio, however, depends on the specific particle size distribution, while the corresponding average size and width can be the same for very different distributions. Now consider the two particle size distributions in Figure 1. Both distributions have the same average size and width of 220 nm and 183.5 nm, respectively. However, one is monomodal while the other shows two modes, hence they differ drastically in their behavior. As a result, the surface to volume ratio of the bi-modal and mono-modal distributions amounts to 7.7 10-3 nm-1 and 1.5 10-2 nm-1, respectively. Considering only the average size and width one would have concluded that the two samples are equivalent whereas their surface-to-volume ratio, and hence their performance differs by more than 50%. Only the knowledge of the full particle size distribution would have allowed us to assess the drastic difference in the quality of the two samples.
 |
||
|
Figure 1 Bimodal and monomodal particle size distribution having both an average size and width of 220 nm and 183.5 nm, respectively |
The DLS technique to Measure Particle Size Distributions
Recovery of physical information from a DLS measurements consists of deriving the particle size distribution (PSD) of particles dispersed in suspensions and solutions, from the measured intensity correlation function (CF).
This problem is mathematically “ill-posed”: many PSDs, even very different from each other, fit equally well to the data of a single measurement. Furthermore, small perturbation of the experimental data, for example, due to the varying degree of impurity and/or experimental noise, can drastically affect the obtained PSD, often leading the inexperienced user to false conclusions.
Among the most common analytical algorithms to obtain the PSD are the CUMULANT and the CONTIN algorithm.
CUMULANT
The CUMULANT analysis is based on a series expansion of the measured correlation function and provides an estimate of the average particle size, and to a lesser extent accurate particle size width. Yielding only two fixed quantities of the PSD, the CUMULANT analysis fails at capturing full information about the PSD. This is illustrated in Figure 2 which shows the true PSD corresponding to a system containing a broadly distributed mono-modal particle population (yellow dashed line) and the PSD corresponding to the average and variance obtained from the CUMULANT analysis (blue solid line). We quickly realize that, even though the two distributions have the same average and variance, their characteristic is drastically different. The slower the CF decays, the more the CUMULANT result fails at capturing the characteristic of the true PSD. This means that the method is reliable only for mono-disperse particle systems with very narrow PSDs which is often not the case for novel or so-called “intelligent” materials in the industry.
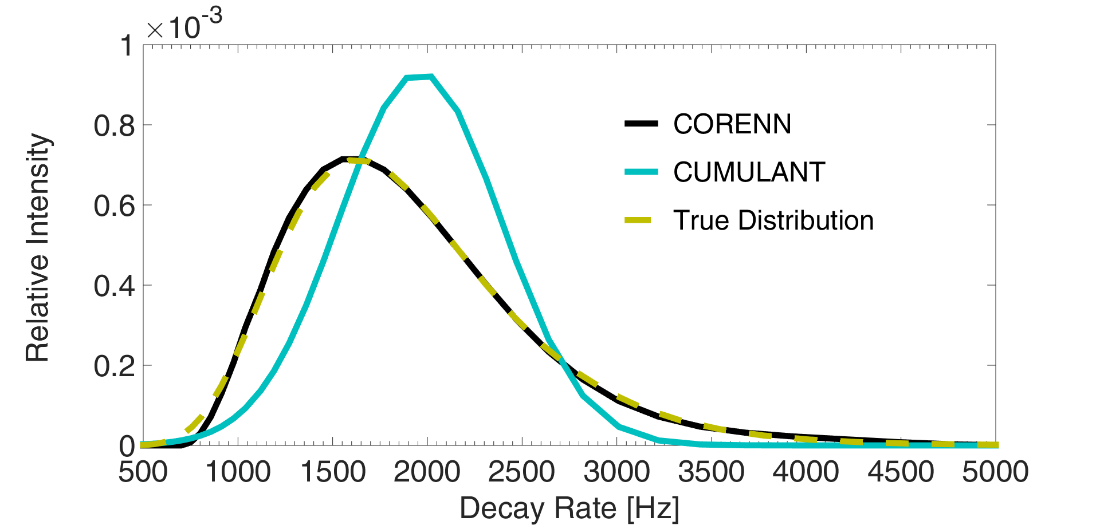
Figure 2 Recovered intensity weighted PSDs from a simulated measurement derived from a broad mono-modal PSD
This issue is even more evident when considering polydisperse systems, where two or more particle populations might be present in the sample. Figure 3 shows the PSD of a bi-disperse system (yellow dashed line) and the corresponding data obtained by means of the CUMULANT analysis. It is evident that CUMULANT analysis leads to grossly inaccurate results when the PSD profile displays more complex distribution.

Figure 3 Recovered intensity weighted PDSs from a simulated measurement derived from a bi-modal PSD.
CONTIN
To overcome the limitations of the CUMULANT method, CONTIN attempts to retrieve the full PSD by solving an inverse integral equation. This approach is mathematically and numerically more complex but can deliver the detailed shape of the PSD thus relaxing the requirement of a narrow mono-modal PSD imposed by the CUMULANT method. CONTIN, however, has several drawbacks:
- it relies on a mathematical linearization of the original problem,
- it uses roughly approximated prior information about the experiment,
- and finally uses a rudimentary criterion for selecting the final solution among the group of possible solutions.
All these limitations result in a lack of robustness of the method, resulting in systematic errors such as PSD shape distortions or false peaks whenever an experiment is affected by systematic measurement error (sample impurities), statistical inaccuracies (short measurement durations), or simply detector noise. In summary, CONTIN is a very good algorithm when the experiments are performed in truly ideal conditions, but fails in real-world measurements where the user cannot guarantee the absolute absence of impurities and measurement noise.
To illustrate CONTIN limitations Figure 4 shows the intensity weighted size distribution derived from a measured correlation function for a monomodal population of particles dispersed in water.
CONTIN detects correctly the main peak. However, it also finds a false peak that could be incorrectly interpreted as an additional particle size-population.
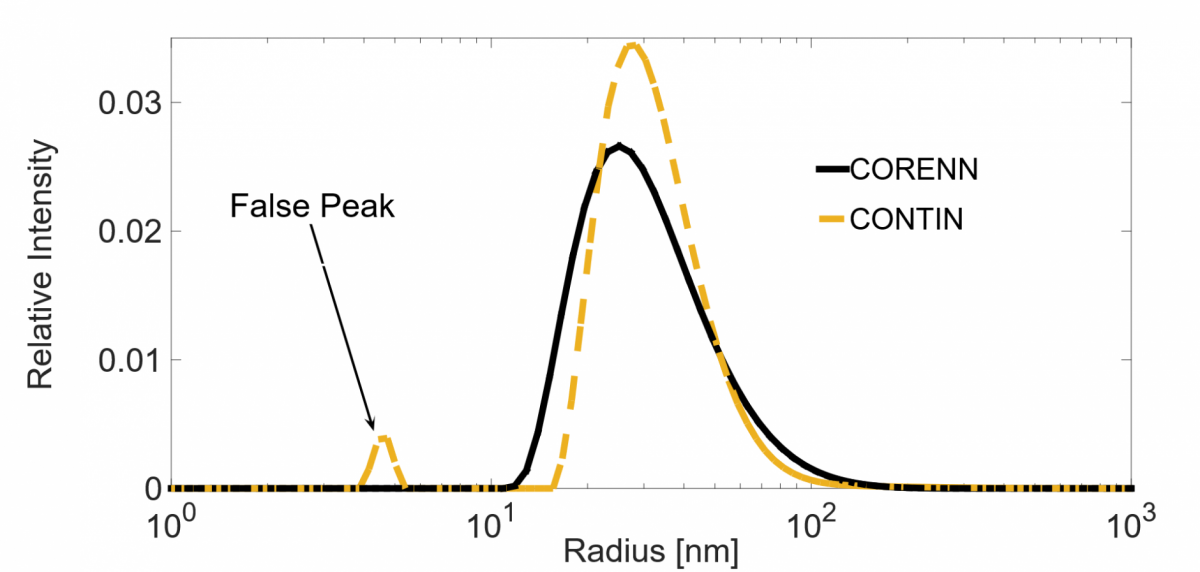
Figure 4 Recovered intensity weighted PDSs from an experimental measurement for a mono-modal size population.
CORENN
Given the technological importance of obtaining a particle size distribution and the limitations of the CUMULANT and CONTIN methods, LSI has developed a novel advanced machine learning algorithm called CORENN to extract the particle size distribution from a DLS measurement. It is based on a COnstrain weighted, REgularized Non-liNear, least-squares fit with free baseline for integral inversion of the ill poised problem.
CORENN addresses CONTIN weaknesses by means four novel development cornerstones
- solution of the non-linear inverse integral equation
- leveraging on a novel robust and fast theoretical estimate of the correlation function noise to remove noisy data
- statistical grounded advanced criterion for the selection of the solution
- Adopting advance signal approximation techniques
these advanced features have led to an extremely reliable algorithm, robust against experimental distortions, and able to predict more reliably the true PSD for a real-world DLS experiment.
To display the performance of CORENN against the Cumulant Analysis method Figures 1 and 2 show the CORENN result for the simulated experiment compared to the true size distribution for both the mono and bi-modal test cases. CORENN’s estimates get remarkably close to original true shapes, by fully capturing the PSD detailed profiles as opposed to the CUMULANT Analysis.
Figure 4 shows the CORENN estimated distribution compared to the CONTIN result for the DLS experiment on the monodisperse sample previously introduced. In this case, the single peak is detected properly without any artifacts (false peaks) clearly demonstrating the improvement in robustness compared to the CONTIN algorithm.
To further demonstrate the performance of the CORENN algorithm we plot three size distributions obtained by means of the CUMULANT, CONTIN and CORENN methods from a correlation function measured for a bi-modal sample in Figure 5. The sample was obtained by mixing two different size populations of sufficiently separated sizes. It is remarkable that CORENN is the only algorithm able to determine the correct distribution profile consisting of two peaks.

Figure 5 Recovered intensity weighted PDSs from an experimental measurement for a bi-modal size population.
One of the key advantages of CORENN consists in leveraging a robust theoretical estimate of the standard deviation (Std) of the noise of the cross-correlation function. This estimation, obtained from just one experiment, allows the algorithm to weight data points depending on their reliability as assessed by the noise estimation itself. This is the key to delivering robustness against signal contamination arising from sample impurities and/or instrumental noise. It is important to stress that without this novel noise estimation algorithm the same statistical noise estimate can only be obtained by the cumbersome and time-consuming procedure of averaging many measurements.
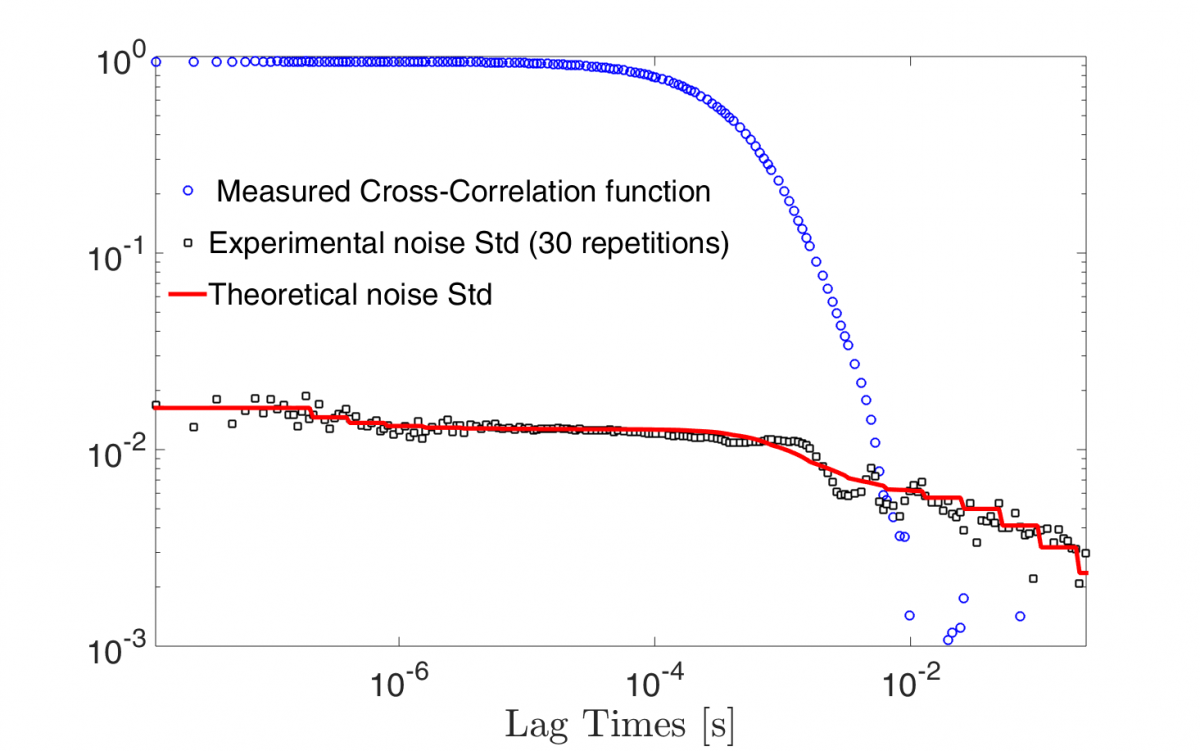
Figure 6. shows the accuracy of our prediction (red line) for a measured cross-correlation function (blue dashed line) compared to the experimental standard deviation of the noise as a function of the lag time obtained over 30 measurements for the same experiment. With the noise estimation model of LSI the results are obtained 30 times faster!
