
Optical Path Length Reduction
Both static and dynamic light scattering rely on the measurement of single scattering events, meaning that each detected photon must have been scattered only once before reaching the detector. Multiple scattering is thus a major issue, as it leads to significant measurement errors, and prevents the characterization of native, undiluted systems. Advanced light scattering techniques such as the Modulated 3D technology, can suppress multiple scattering such that the result obtained is reliable. In a typically turbid sample, both multiple and single scattering events are taking place and the “filtered” signal consists solely of single scattering events.
However, some systems are so turbid that only multiple scattering is detected. In such cases, the entirety of the signal is filtered out and no reliable DLS signal can be measured. One must therefore ensure that a minimum of single scattering events is recorded.
This can be achieved by placing the sample cell such that the optical path length within the sample is reduced. Figure 1 shows two possible sample cell positions:
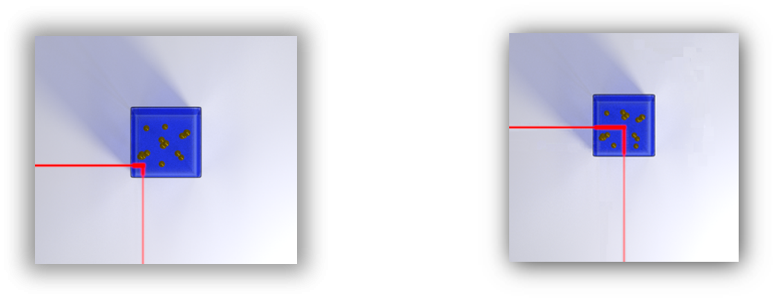
a) Corner position: reduces multiple scattering. Used for concentrated samples. b) Body position: ideal to provide a clean signal when measuring a dilute system.
Figure 1: Positioning of the sample cell.
In Figure 1a), the cell is placed such that the laser beam enters as close as possible to its corner, and the optical path length can be lowered down to 100 mm, as allowed by the reproducibility precision of the cuvette positioning and the dimensions of the cuvette. Since the probability that a photon is scattered multiple times before reaching the detector is proportional to the laser beam and detection beam path lengths within the cell, the optical path length reduction results in a drastic decrease of the number of multiple scattering events. At the same time, the number of single scattering events is increased. This means that, even in opaque suspensions, one can record single scattering events and thus obtain a reliable DLS signal.
In the opposite situation of dealing with extremely dilute samples, a different problem must be addressed: the vicinity of the cell wall to the scattering volume gives rise to scattering events, known as stray light scattering events, originating from the cell walls which alter the desired signal. If the frequency of such events becomes comparable to the low number of scattering events, given the diluted conditions, occurring in the sample the final DLS measurement result becomes invalid. In this case, one can move the sample cell in the so-called body position such that a sufficient distance from the cell wall is established (see Figure 1b)).
Translation of the sample is possible in both the NanoLab 3D and LS Spectrometer. In combination with the Modulated 3D technology, one can span the widest range of concentration possible nowadays.
In systems where the scattering angle can be changed as required by SLS and/or angle-dependent DLS, the technical implementation of the optical path length reduction is more challenging: Figure 1a) suggests that, if the detection virtual beam is rotated, its angle of incidence on the cell wall will be different from the angle of incidence of the illumination beam; as a result, a scattering angle change will result in an alignment loss. To overcome this limitation, one has to rotate the cell around the scattering volume by an angle such that the two angles of incidence are equal. This technique, illustrated in Figure 2, goes under the name of " technique" and requires a very precise rotation around the axis orthogonal to the scattering plane and passing through the scattering volume. Such rotation must be implemented by a rotation stage that has to be coupled to the two translational stages required to place the scattering volume in the desired position. In the LS Spectrometer, this is achieved using the optional Sample Goniometer. This unit allows for both rotation and translation of the sample with high precision1.
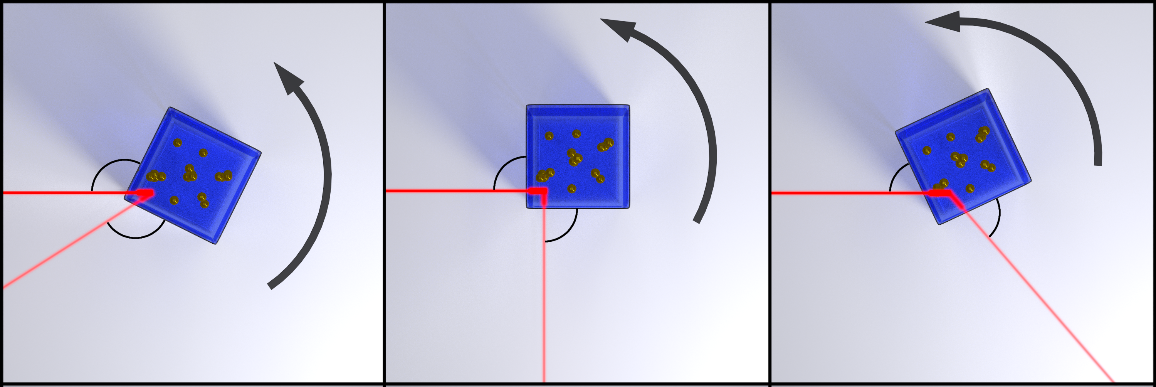
Figure 2: Rotation of the square cell in the corner position according to the technique.
1 For more information about the Sample Goniometer option of the LS Spectrometer please visit:
https://lsinstruments.ch/en/products/ls-spectrometer#option-sample-goniometer