
Viscoelasticity
A fluid can be defined as viscoelastic when it is able to store part of the energy transferred to it through a deformation as elastic energy. In this case, an elastic modulus will also be attributed to a sample. This class of materials shows a behavior that is intermediate between the liquid- and the solid-like state. As long as the elastic modulus is independent of the amplitude of the deformation applied to the system, it is within the linear viscoelastic regime.
Linear Viscoelasticity (LVE) can be studied through both macro- and microrheology. In the former case, rheometers are commonly employed to perform three different experimental techniques:
creep-recovery; step strain; frequency sweep [1,2].
Creep-recovery
During this experiment, the fluid is subjected to a constant shear stress, σ, which is then removed, and the deformation or strain, γ, is studied as a function of the time. The result of the measurement depends on the nature of the material, see Figure 1a.
Step strain
In this experiment, the fluid is subjected to an instantaneous strain, γ, kept constant, and the shear stress σ is recorded as a function of the time. As for the creep, the result of a step strain measurement is dependent on the nature of the fluid, as shown in Figure 1b.
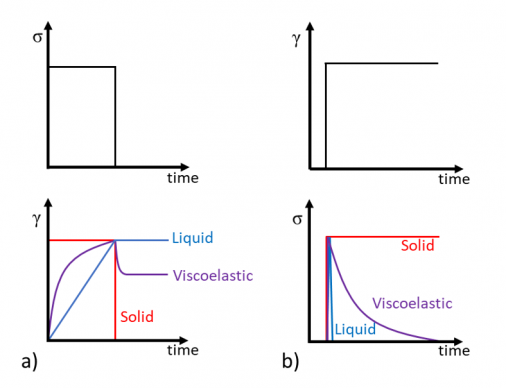
Figure 1. (a) Creep-recovery and (b) step strain measurements for solid, viscoelastic and liquid systems (red, purple and blue curves, respectively).
Frequency sweep
This is the standard experiment to investigate viscoelastic fluids. During the measurement, a sinusoidal shear strain γ is applied to the material.
(1)
where is the maximum strain and ω is the angular frequency. Under these conditions, the fluid response is a sinusoidal shear stress σ characterized by the same oscillatory frequency of the applied strain, but with an out-of-phase angle, φ
(2)
The phase angle φ can range between 0 and 90°; and depending on its value, the material is classified as liquid (φ=90°), solid (φ=0°) or viscoelastic (0°<φ<90°). An example of a frequency sweep response is given in Figure 2.
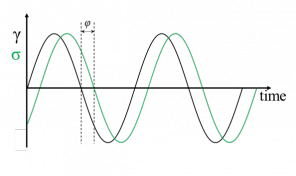
Figure 2. Oscillatory measurement where γis the applied strain (black curve) and σ is the shear stress-response of the fluid (green curve).
The fluid response (eq. 2) can be expressed also as:
and, by dividing the shear stress by the maximum strain applied, it is possible to define the storage and loss moduli (Gʹ and Gʺ, respectively), that represent the elastic and viscous components of the material:
being
Combining the loss and storage moduli, it is possible to express the complex modulus G* and the complex viscosity η∗ as:
During a frequency sweep measurement, the angular frequency varies, probing structural information at different length-scale (persistence and entanglement length mesh size, interparticle distance, etc), which are crucial for the processing or development of products (Figure 3).
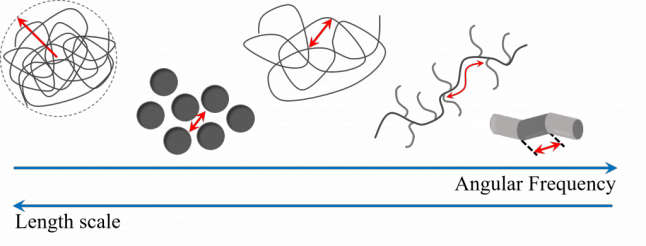
Figure 3. Sketch of a typical length scale probed by frequency sweep measurement.
A frequency sweep thus reveals the different behaviors shown by the material at different length-scale. Within the linear regime, the most general Gʹ and Gʺ response is shown in Figure 4, where some of the possible behaviors are indicated [3]. However, it is worth noting that such a wide range of frequencies cannot be measured with mechanical rheometers, because of their upper-frequency limit. However, the intermediate and high frequencies can be covered by microrheology experiments, which, thus, is a complementary method with respect to macrorheology.

Figure 4. Sketch of a typical oscillatory response in a double logarithmic scale
[1] Macosko, C.W. (1996) Rheology: Principles, measurements, and applications, Wiley.com. Available at: https://www.wiley.com/en-us/Rheology%3A+Principles%2C+Measurements%2C+and+Applications-p-9780471185758 (Accessed: January 4, 2023).
[2] Barnes H.A.; A Handbook of Elementary Rheology, The University of Wales Institute of Non-Newtonian Fluid Mechanics (2000).
[3] J.D. Ferry, Viscoelastic properties of polymers, 3rd Edition, Wiley, New York 1980.